Manage New Post Logout Login

Power of Data Visualization

An infographic inspiration site.

Tag art

« Back to blog

A guide to drawing the body

A guide to drawing the body.

via ilovecharts.tumblr.com
Tags
  • art
  • body
  • drawing
  • education
  • guide
  • human
  • infographic
  • tips
Upvote Upvoted 0
Tweet
Posted

Timeline of 20th c. Art and New Media

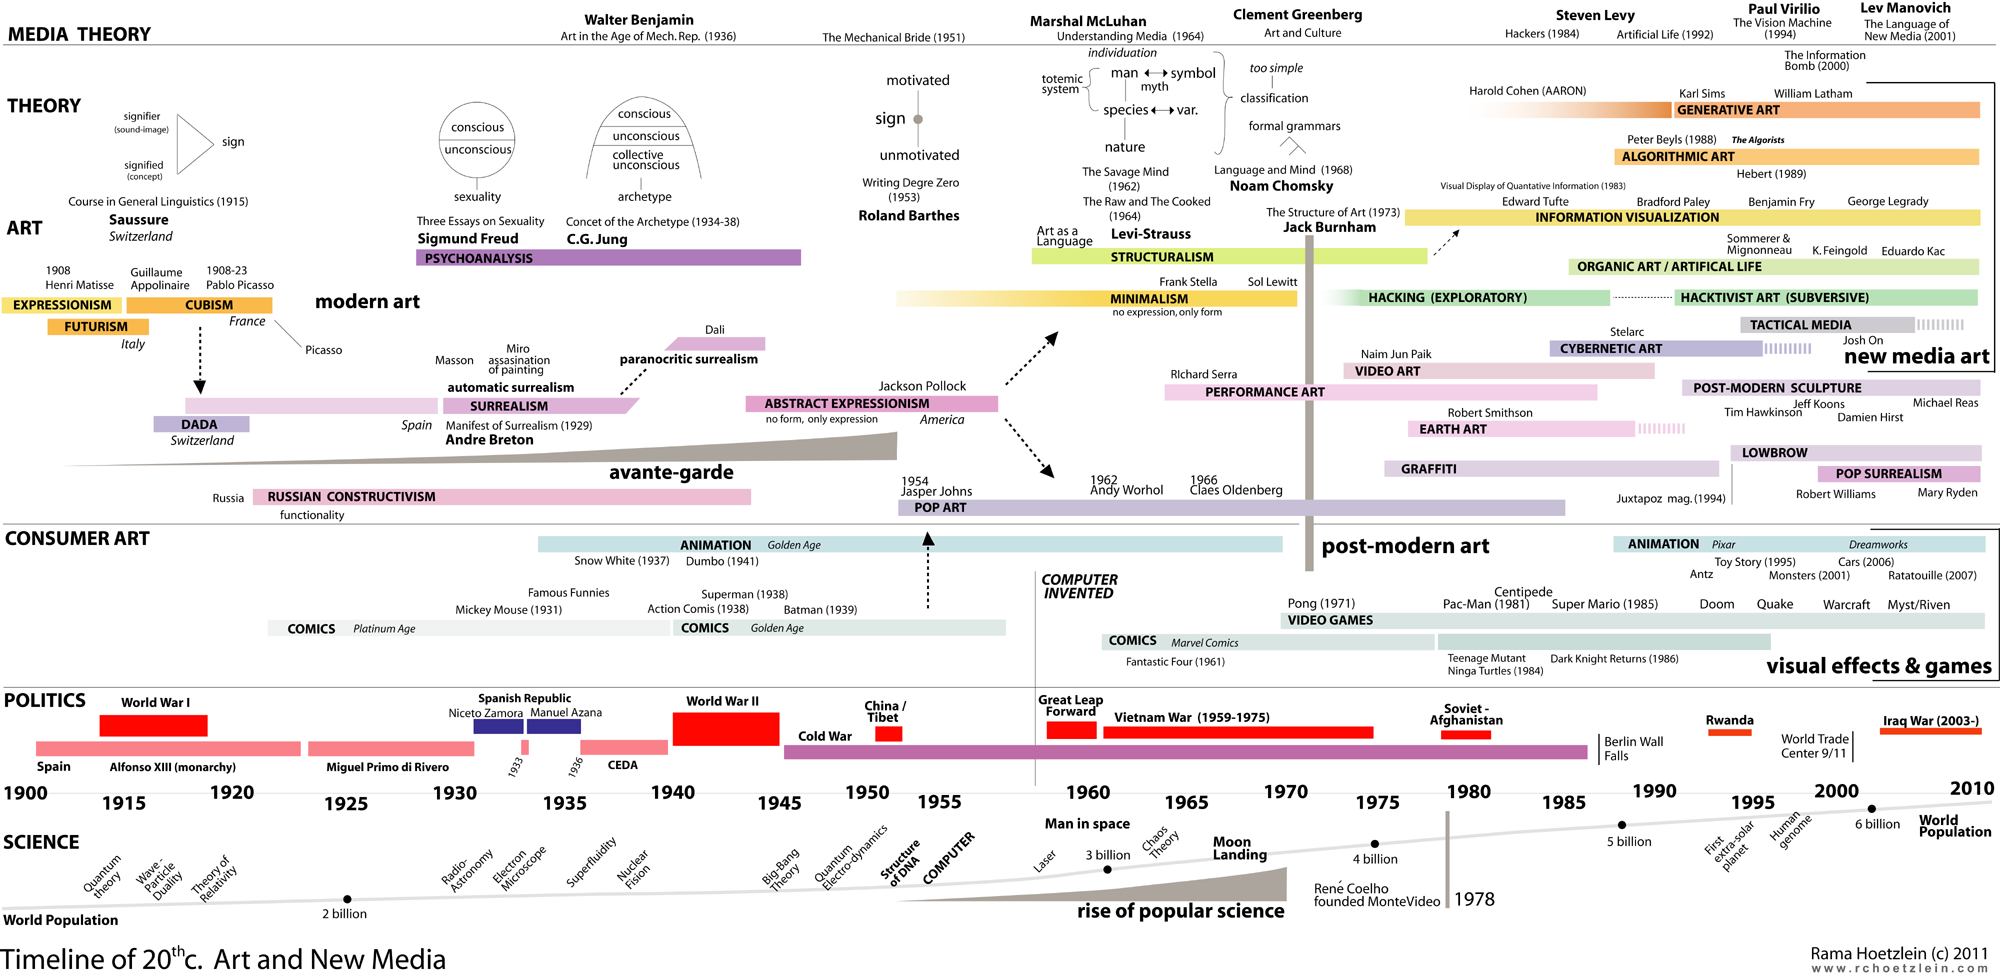
This Timeline of 20th c. Art and New Media was created to include relationships between art, new media art, science, technology, war and media theory.

via www.rchoetzlein.com
Tags
  • Art
  • History
  • infographic
  • New Media
  • science
  • technology
  • Timeline
  • war
Upvote Upvoted 0
Tweet
Posted

The whole world in her hands

via flickr.com

The whole world in her hands

Tags
  • art
  • hand
  • map
  • photography
  • world
Upvote Upvoted 0
Tweet
Posted

The 10 Most Expensive Pieces of Art Ever Sold

via awesome.good.is

Walking Man I by Alberto Giacometti sold for $104.3 Million (2010)

Tags
  • alberto
  • art
  • expensive
  • giacometti
  • infographic
  • sold
Upvote Upvoted 0
Tweet
Posted
  • Home
  • About Us
  • Interactive
  • Video
  • Sex
  • Facts
  • Maps
  • Funny
  • History
  • Submit Tip
  • Contact

Browse the Archive »
Subscribe by email » We'll email you when there are new posts here.
You're following this blog. Unfollow »
Follow this Posthaven »
Enter your email address to get email alerts about new posts on this site. Unsubscribe anytime.
Email address is invalid.

Tags

  • infographic 1881
  • america 281
  • map 264
  • history 186
  • interactive 160
  • world 150
  • comparison 113
  • timeline 102
  • video 94
  • internet 88
  • See all 2818 tags »
  • Get Updates

    • Subscribe via RSS
    • Follow me on Twitter
    • Become a fan on Facebook
  • My Other sites

    • Bear Bear Bear
    • Funny Pictures
    • Findings
  • Visualization tools

    • Many Eyes
    • Charts Bin
    • Google Chart Tools
    • Protovis
    • ParaView
    • d3.js
  • Recommended sites

    • Chart Porn
    • Eagereyes
    • Flowing Data
    • Information aesthetics
    • Information Is Beautiful
    • Visual Loop
    • Visual complexity