Manage New Post Logout Login

Power of Data Visualization

An infographic inspiration site.

Tag war

« Back to blog

T-90 main battle tank

Designed by Uralvagonzavod in Nizhny Tagil, Russia, in late 1980s - early 1990s as a modernized version of the T-72 tank

via en.rian.ru
Tags
  • battle
  • infographic
  • Machine
  • Military
  • T-90
  • tank
  • War
Upvote Upvoted 1
Tweet
Posted

U.S. losses in Iraq in 2003-2010

Coalition forces military and police deaths for seven years of the US. military presence in Iraq.

via en.rian.ru
Tags
  • 2003
  • 2010
  • America
  • Bar chart
  • History
  • infographic
  • Iraq
  • War
Upvote Upvoted 0
Tweet
Posted

How America's opinion of the Iraq war has changed?

Over seven years after the invasion of Iraq in March 2003, America's direct military involvement is now coming to an end. President Barack Obama will set out his new policy in a speech from the Oval Office on Monday August 31st. American public opinion on the war has changed enormously during that time.

via www.economist.com
Tags
  • America
  • infographic
  • Iraq
  • opinion
  • survey
  • war
Upvote Upvoted 0
Tweet
Posted

Timeline of 20th c. Art and New Media

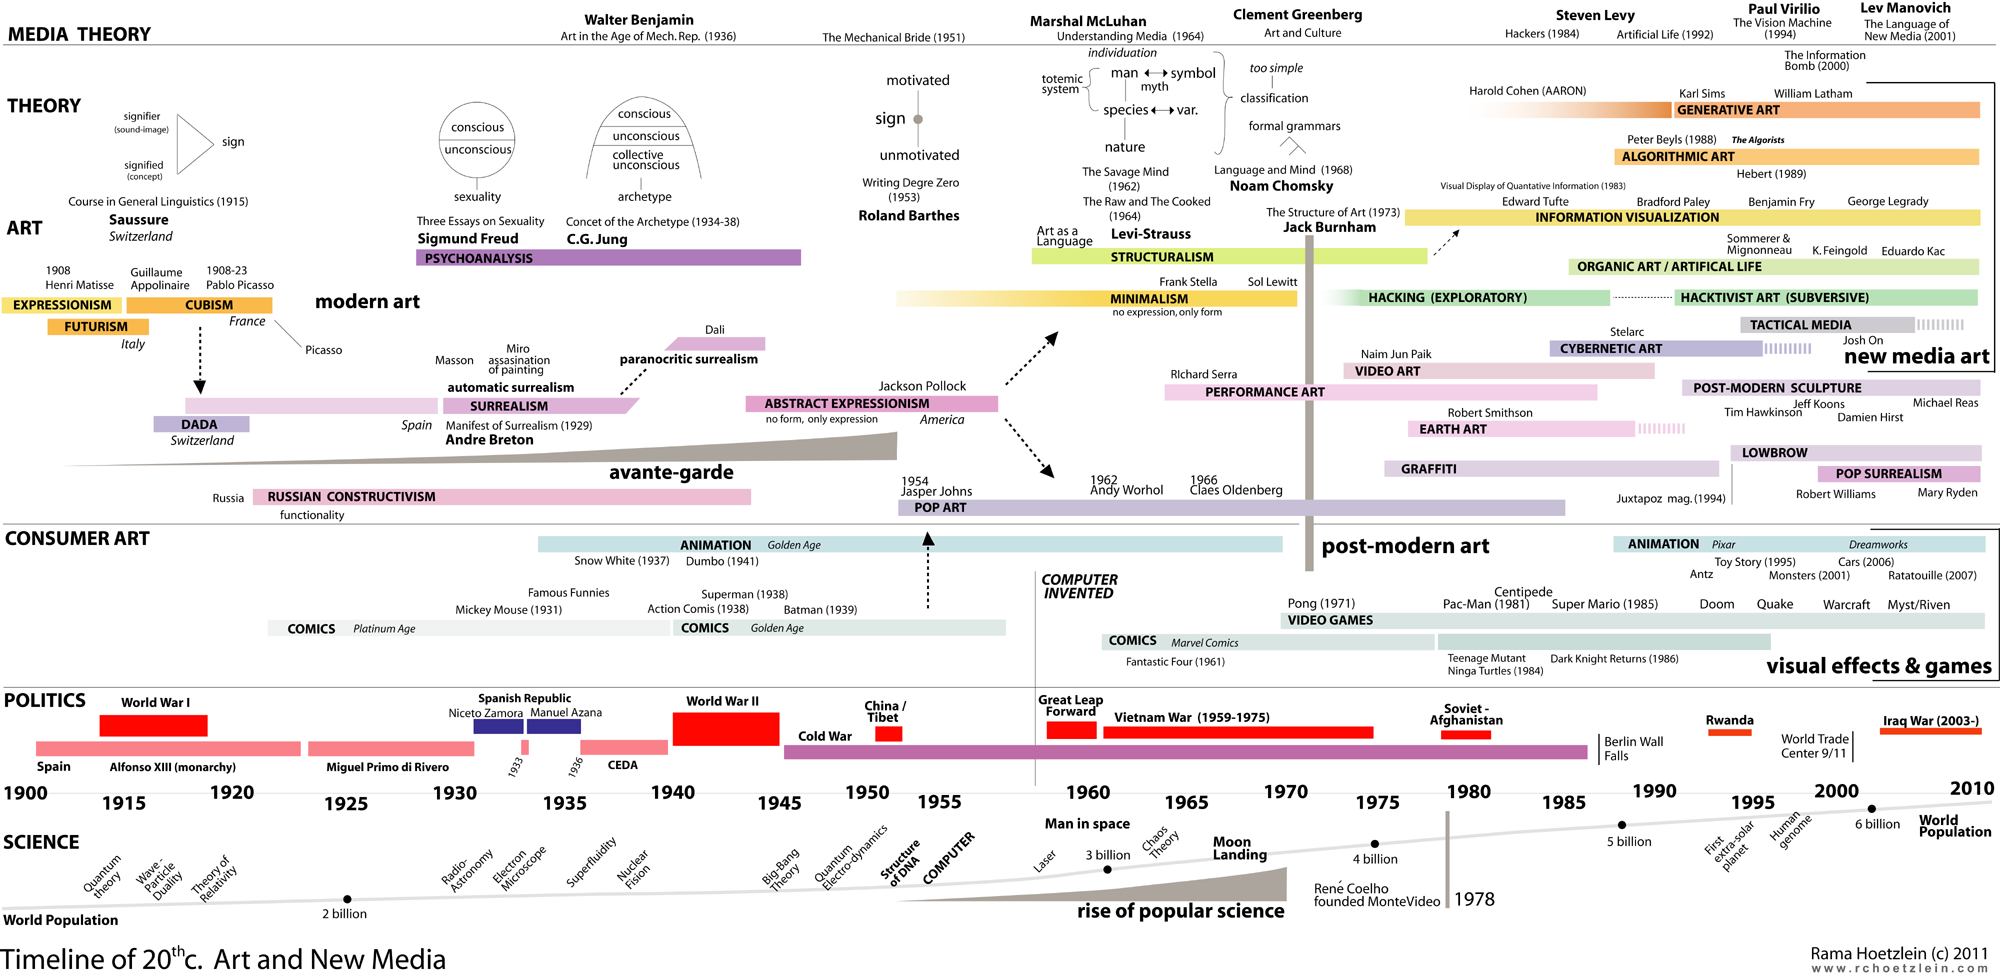
This Timeline of 20th c. Art and New Media was created to include relationships between art, new media art, science, technology, war and media theory.

via www.rchoetzlein.com
Tags
  • Art
  • History
  • infographic
  • New Media
  • science
  • technology
  • Timeline
  • war
Upvote Upvoted 0
Tweet
Posted

US Soldiers - 2009

Committed suicide vs killed in iraq.

via platypusrex256.tumblr.com
Tags
  • America
  • comparison
  • death
  • infographic
  • Iraq
  • killed
  • Soldiers
  • suicide
  • war
Upvote Upvoted 0
Tweet
Posted

Wikipedia's Lamest Edit Wars

Articles of war

via www.informationisbeautiful.net
Tags
  • Article
  • edit
  • infographic
  • War
  • Wikipedia
Upvote Upvoted 0
Tweet
Posted

Wikileaks: a timeline of the site's top scoops

The whistleblowing website Wikileaks has released a document containing reports from 90,000 incidents in the Afghanistan war. Here's an infographic showing some of the other top scoops released on the site.

via www.telegraph.co.uk
Tags
  • Afghanistan
  • documents
  • history
  • incidents
  • infographic
  • timeline
  • war
  • Wikileaks
Upvote Upvoted 1
Tweet
Posted

WikiLeaks Afghanistan War Logs on Google Maps

On Sunday WikiLeaks released 92,201 records of individual events or intelligence reports from US military files pertaining to the war in Afghanistan.The Guardian has also produced an interactive Google Map. The Guardian's 'The War Logs Map' geotags a selection of 300 of the key intelligence reports.

via www.guardian.co.uk
Tags
  • Afghanistan
  • Google
  • infographic
  • interactive
  • Logs
  • Map
  • War
  • WikiLeaks
Upvote Upvoted 0
Tweet
Posted

How the nuclear weapons era began?

The atomic bomb was first tested on July 16, 1945.

via en.rian.ru
Tags
  • atomic bomb
  • history
  • infographic
  • nuclear
  • timeline
  • war
  • weapons
Upvote Upvoted 0
Tweet
Posted

The Russian-Indian BrahMos supersonic cruise missile

via en.rian.ru
 
The Russian-Indian BrahMos supersonic cruise missile.

Tags
  • BrahMos
  • India
  • infographic
  • missile
  • Russia
  • supersonic
  • war
Upvote Upvoted 0
Tweet
Posted
  • ‹ First
  • « Previous
  • 1
  • 2
  • 3
  • Next ›
  • Last »
  • Home
  • About Us
  • Interactive
  • Video
  • Sex
  • Facts
  • Maps
  • Funny
  • History
  • Submit Tip
  • Contact

Browse the Archive »
Subscribe by email » We'll email you when there are new posts here.
You're following this blog. Unfollow »
Follow this Posthaven »
Enter your email address to get email alerts about new posts on this site. Unsubscribe anytime.
Email address is invalid.

Tags

  • infographic 1881
  • america 281
  • map 264
  • history 186
  • interactive 160
  • world 150
  • comparison 113
  • timeline 102
  • video 94
  • internet 88
  • See all 2818 tags »
  • Get Updates

    • Subscribe via RSS
    • Follow me on Twitter
    • Become a fan on Facebook
  • My Other sites

    • Bear Bear Bear
    • Funny Pictures
    • Findings
  • Visualization tools

    • Many Eyes
    • Charts Bin
    • Google Chart Tools
    • Protovis
    • ParaView
    • d3.js
  • Recommended sites

    • Chart Porn
    • Eagereyes
    • Flowing Data
    • Information aesthetics
    • Information Is Beautiful
    • Visual Loop
    • Visual complexity